Download your FREE hi-res PDF of the Campaign Brief Hot+Cold Chart for Sydney+Melbourne, Perth, Adelaide, Brisbane and New Zealand
The annual CB Agency Creativity/Billings Index (or Hot+Cold Chart) is a must for all agency CEOs and ECDs plus marketers on the look-out for a new agency – or to see where their agency is placed in the industry.
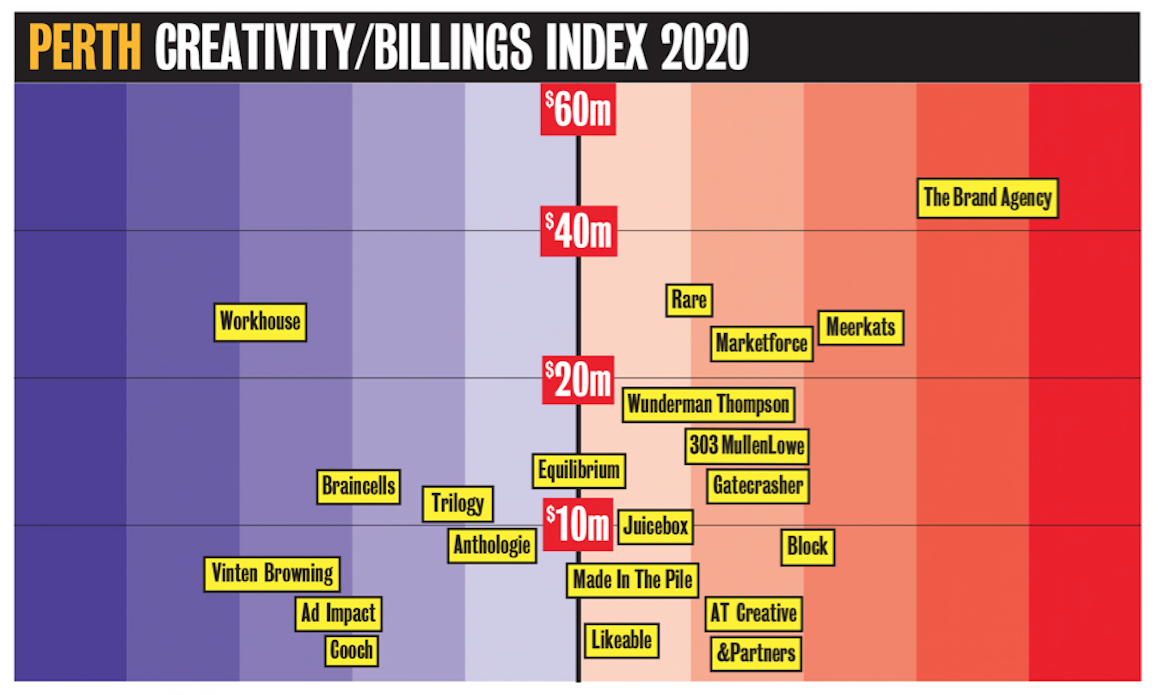
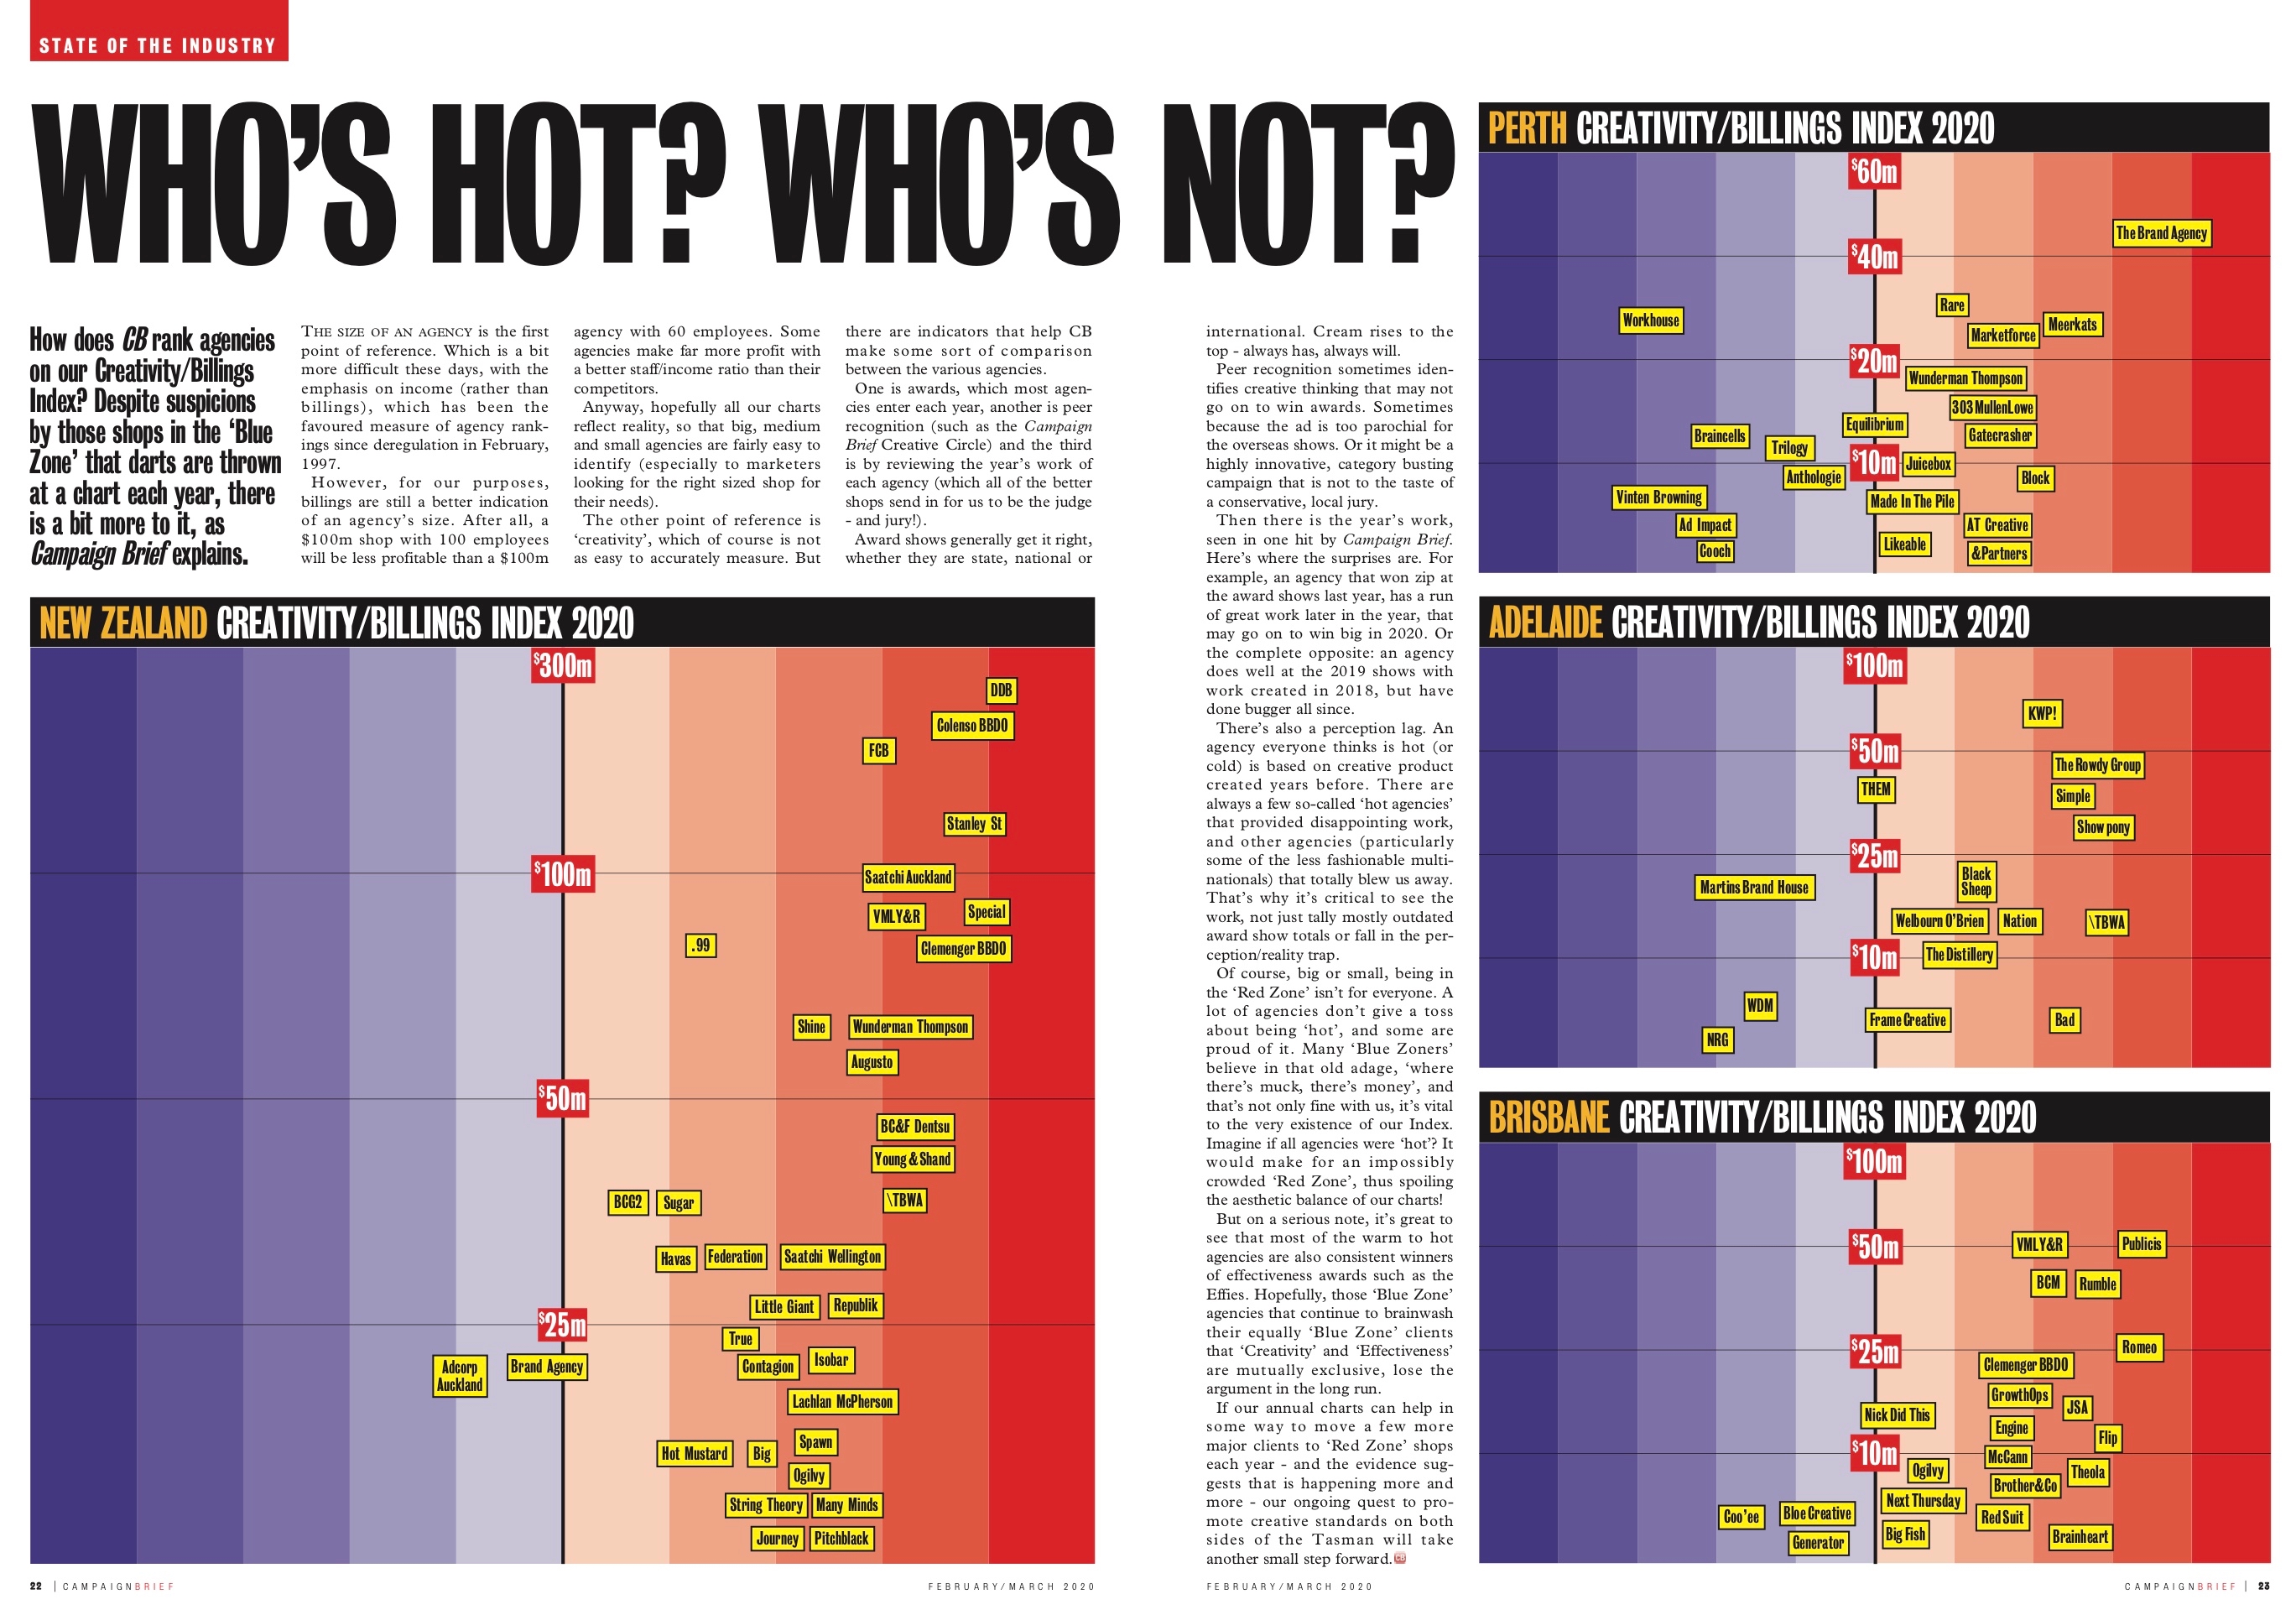
There is a chart for Perth, Melbourne/Sydney, Adelaide and Brisbane, as well as New Zealand.
These hi-res PDFs can be printed out and pinned on your wall – or you can blow up to A2 or A1 and frame.
Download the 2019 Adelaide Chart:
Download the 2019 Brisbane Chart:
CB-HOTCOLD-CHART-QLD-2020
About the CB Hot+Cold Chart:
While size may be important to some big clients (“I’ve got a bigger agency than you”), it is by no means the only measure of an agency’s worth. Which is why Campaign Brief introduced in 1997 a new way of measuring our agencies: by relating their size to their creative product.
That way, clients seeking a big, creative agency know where to look. Some may prefer a small, creative shop. Others may seek a big, conservative operation. Or a small shop that pumps out what they want, when they want it, at the right price.
Whatever their tastes, CB make it easier to see where a selection of agencies in Australia and New Zealand sit in our 23rd Annual Big vs Small – Hot vs Cold cross-analysis.
You can view this issue and past CB issues and subscribe at Campaign Brief Online or contact Mina via email.
1 Comment
When you’re hot you’re hot, and when you’re not you’re not!